APY.vision Uniswap V3 feature guide
In this guide we will go over the new features added to APY.vision to assist in managing Uniswap V3 positions.
APY.vision announces Uniswap V3 support
We are happy to announce that we have launched support for Uniswap’s innovative upgrade to their platform for traders and liquidity providers. Uniswap V3 adds many new layers of complexity and we have built analytics features to give LP’s the data they need to make intelligent decisions about when and where to provide their liquidity.
Things to know before using Uniswap v3
- Concentrated liquidity amplifies fee revenue but also impermanent loss
- Uniswap V3 is available on Ethereum mainnet, Arbitrum and Polygon. You can save a lot of money in gas costs by using Arbitrum or Polygon
- The volume and liquidity is separate for each chain
- Instead of being part of a fungible liquidity pool like version 2, you get an NFT “position” that is unique to the parameters you set for the position
- Uniswap.info will share some basic information about your position, but will not show historical APY, impermanent loss and many other important metrics
Portfolio View – In and Out of Range Indicators
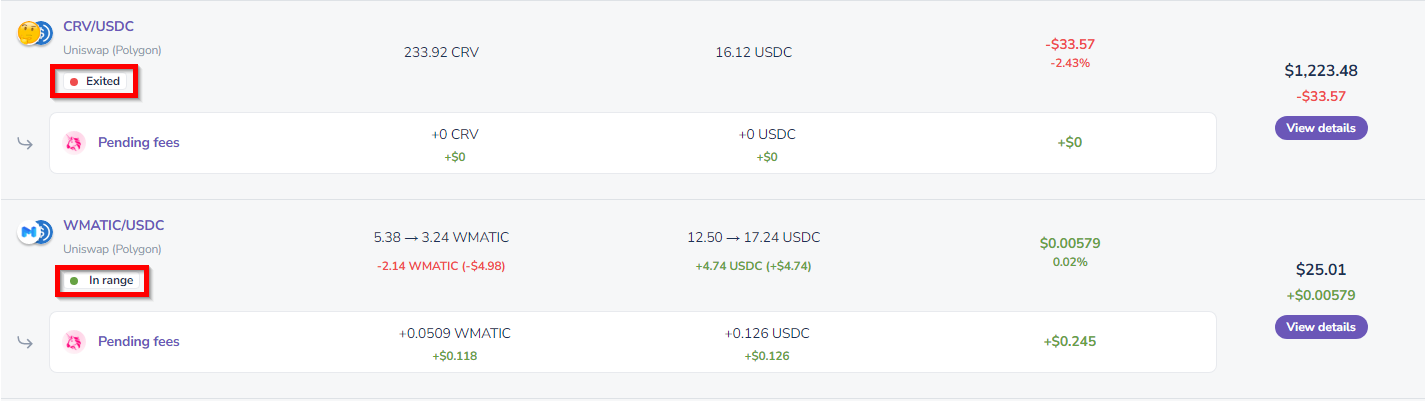
What you are seeing pictured above is the basic portfolio view of your positions. This should feel familiar to APY.vision veterans. The interface displays the initial starting token balances for each asset in the positions and compares it to the current token balance to highlight the changes made by pool activity. To learn more about a given Uniswap V3 position, you will want to click the purple “View Details” button on the right side and it will bring you to the pool position page where you can view more advanced analytics.
One new feature you can see highlighted in red above is our new badge that tells you if you are in or out of range on your Uniswap V3 position. When you are “In Range” it shows a green circle and when you are out of range then the circle turns red. This is important because if you are out of range you are not earning fees, so it might be a call to action to adjust the position depending on a few other factors. That area will also display if the position has been exited and is no longer active.
Uniswap V3 Position Page – “Market Value”
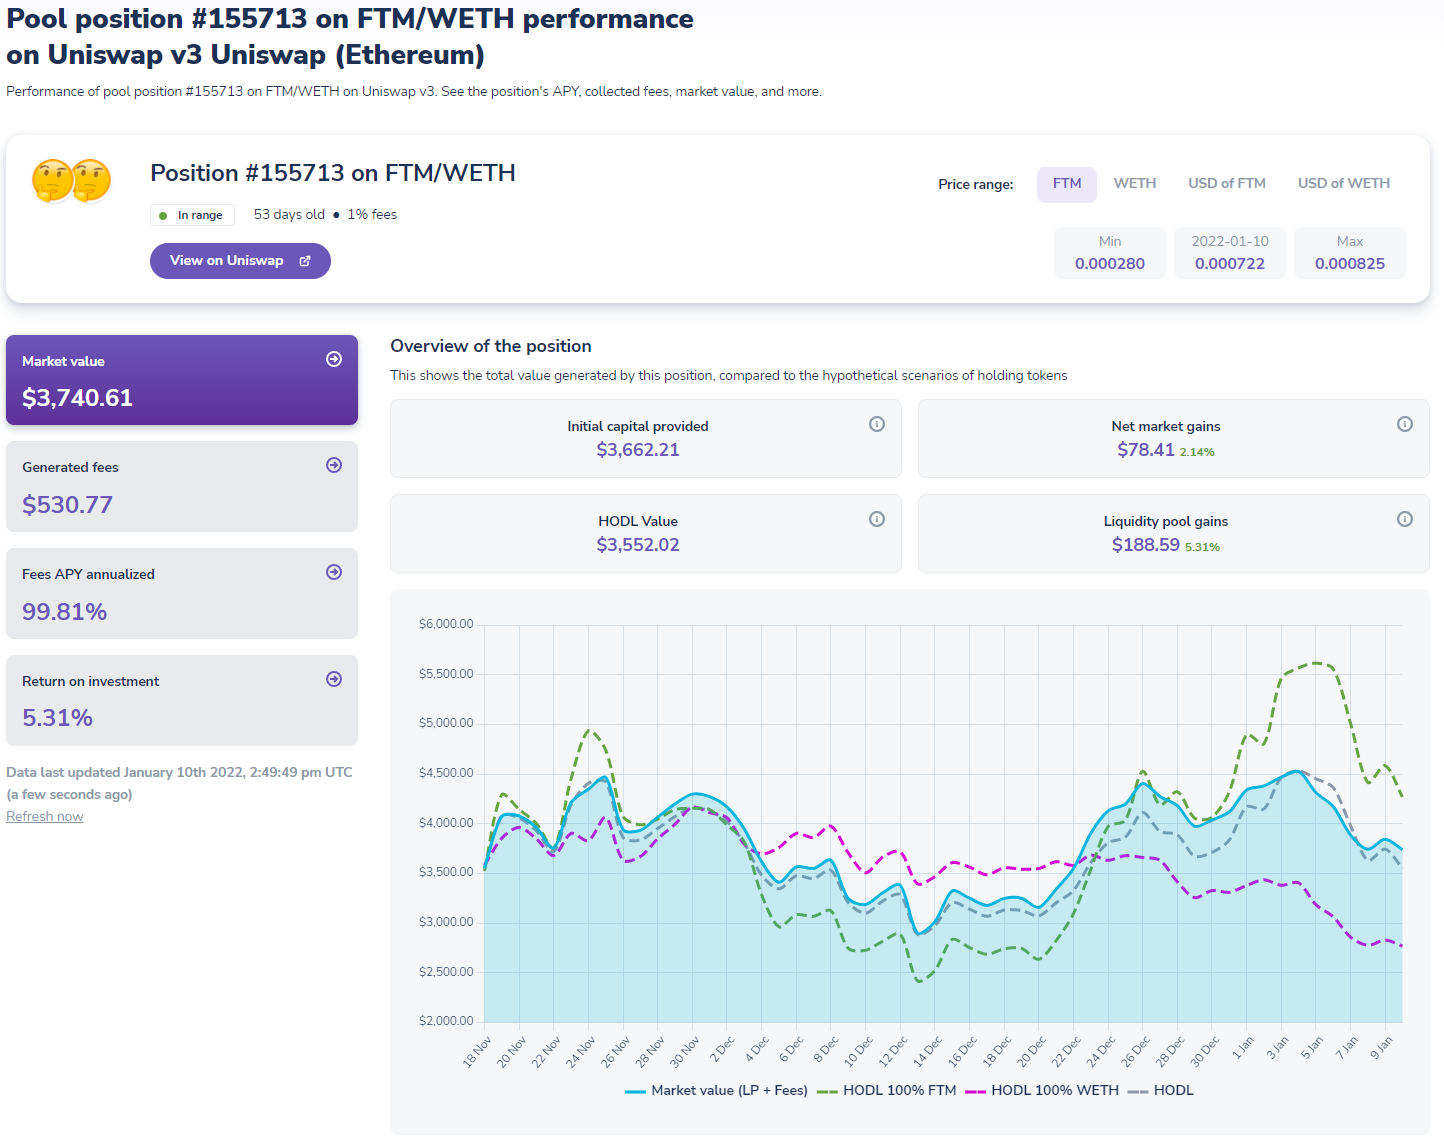
The details page will load on the “Market value” tab by default, giving a basic overview of the positions and some charts showing market performance in several different hypothetical situations. This chart is comparing the market value of your LP position with collected and pending fees included against 3 other situations, holding both tokens in the amount you deposited them at, holding 100% of one of the tokens in the pair, or 100% of the other token in the pair.
“Initial Capital Provided” – the value of your position at the time of deposit
“Net Market Gains” – profit or loss based on the market price fluctuation of the tokens, using the formula: “position value” + “generated fees” – “initial capital” = “net market gains”
“HODL value” – hypothetical value of original tokens in original quantities at current market prices
“Liquidity Pool Gains” – Total profit or loss excluding market conditions. It is the difference between the initial assets at current value (HODL value), compared to the current assets at the current value (Market value) which includes generated fees
Uniswap V3 Position Page – “Generated Fees”
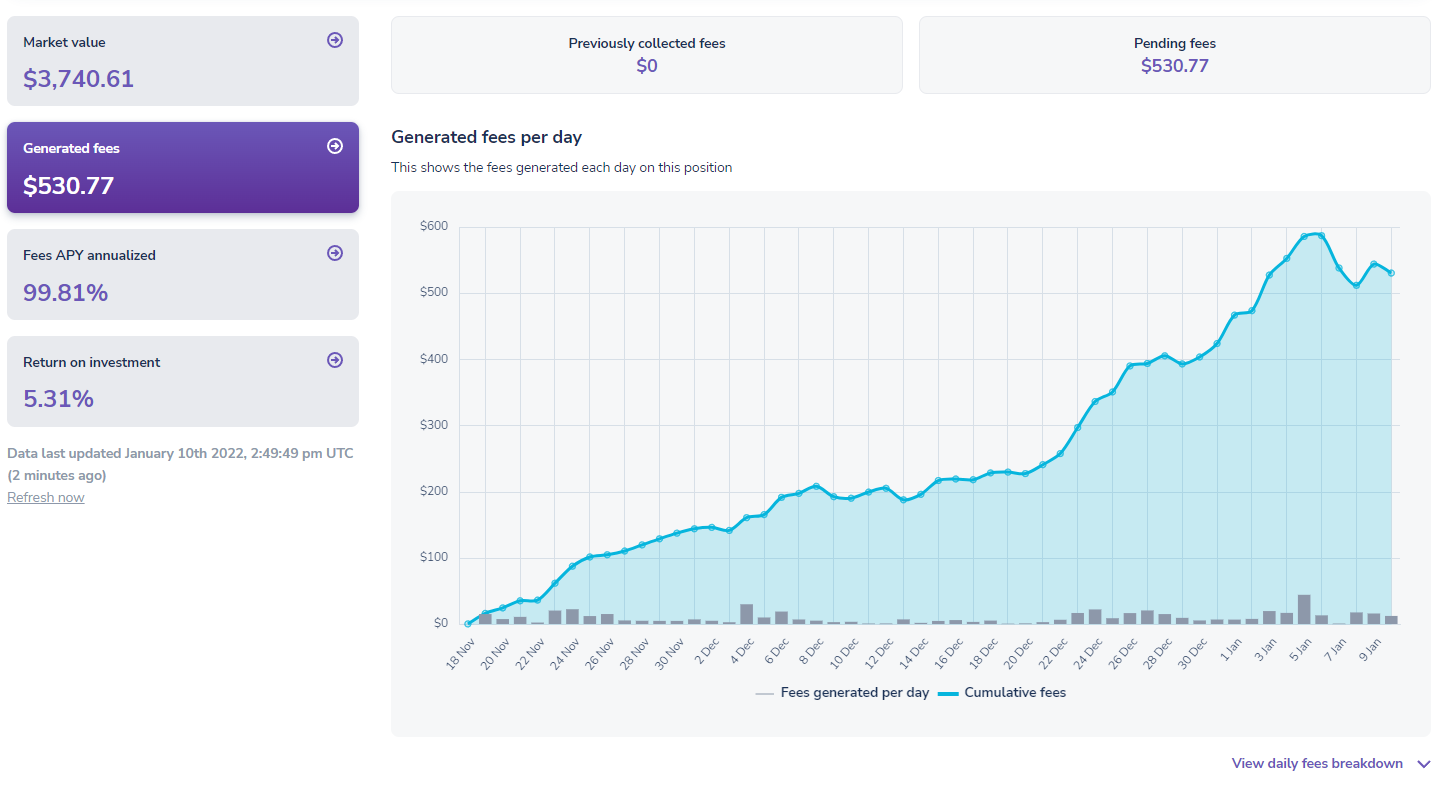
Clicking down to the next tab “Generated Fees” will show a chart with daily fee revenue, cumulative fee revenue and the total amount of pending fees. It is important to remember that fees are collected in the denomination of the token pair, but the APY.vision interface converts that to a USD value.
This means that fee revenue can go up or down depending on changes in market price of the underlying assets (In this case FTM and ETH).
Your revenue can be going up in absolute terms of the underlying token (i.e. collecting more FTM or ETH) but still be decreasing in USD terms. This can happen both when you are in range or out of range, the value of fees will not be stable unless it is denominated in a stable asset like a stablecoin.
Uniswap V3 Position Page – “Fees APY” annualised”
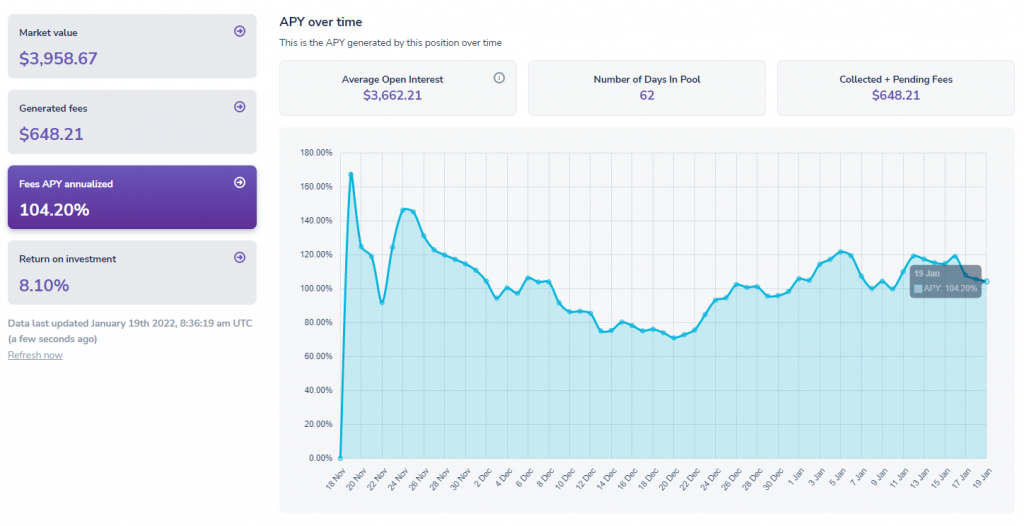
The next tab below titled “Fees APY annualised” displays a chart showing the performance of the position in APY terms to indicate hypothetical yearly performance since inception. Soon we will show prior day APY, prior 7-day APY, and many other additional features.
“Average Open Interest” – This is the amount that you have invested in this position over its lifetime, considering partial enter/exits. We use this amount to calculate your APY since inception
Uniswap V3 Position Page – “Return on Investment”
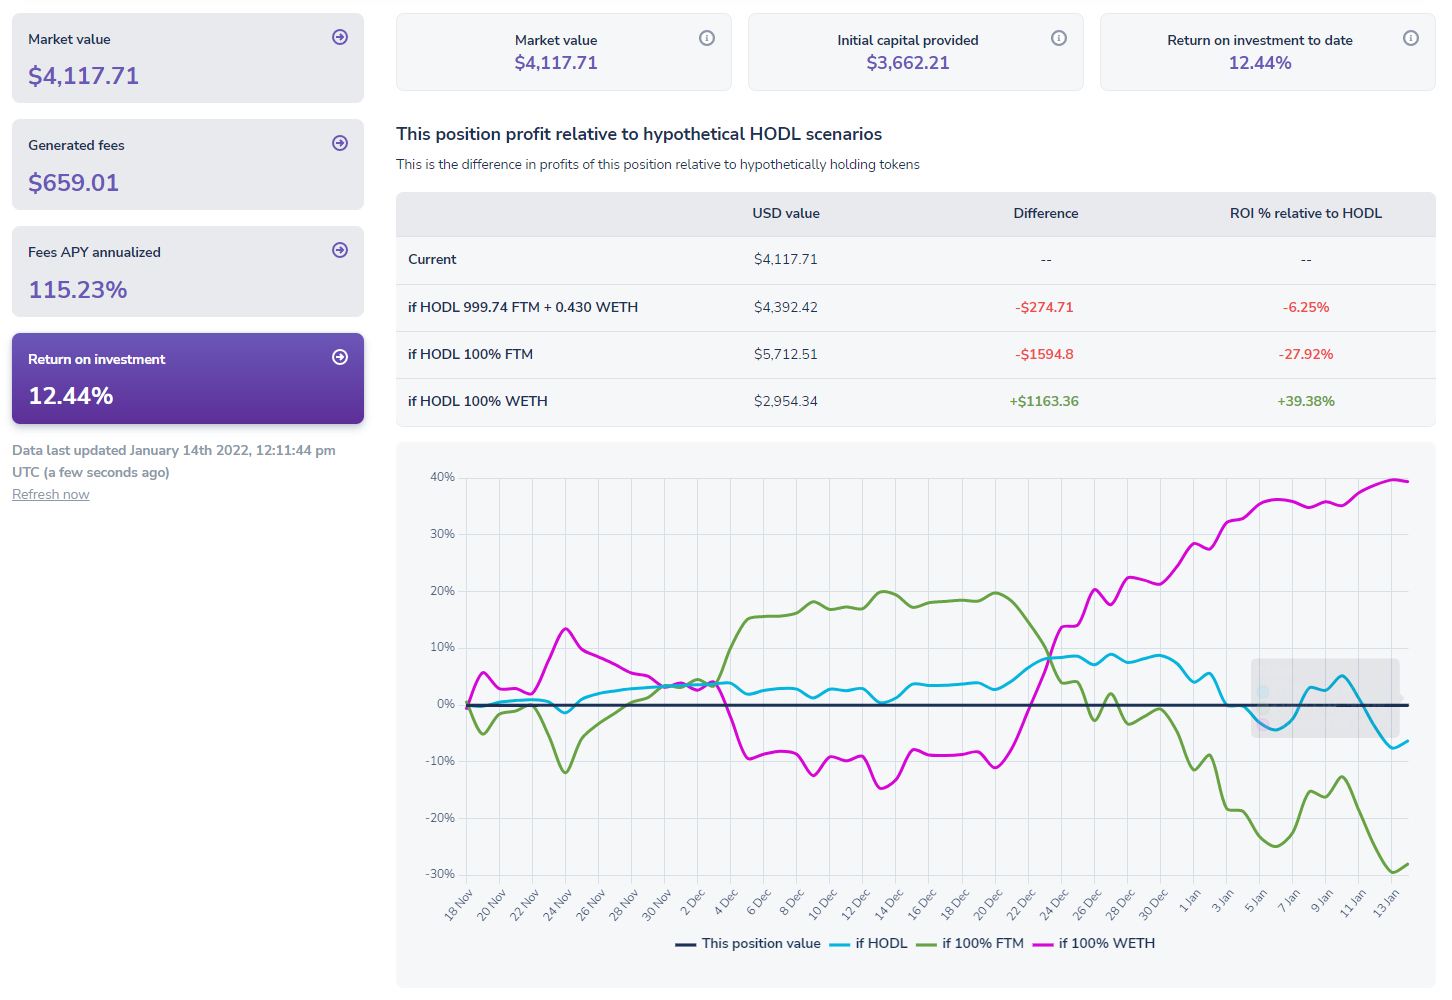
The final tab shows “return on investment” and gives several hypothetical situations to compare your performance with. It compares the market value with the value if you had held the same position and not provided liquidity to the pool. Much like the “Market Value” chart, it also compares the different situations like holding 100% of either of the tokens instead of entering the pool.
“Market Value” – The position value in USD including the pending and collected fees
“Initial Capital Provided” – The value of your initial deposit
“Return on Investment to date” – The current ROI of this position compared to the initial capital provided
Join our Community!
If you have any questions about the new features on APY.vision, feel free to come join our Discord community and share them! Our community is super helpful and we always like to hear input from our users. If you experience and bugs or notice problems with the website, you can create a ticket via our support system. If there are features you would like to see added to the website, you can make suggestions or vote on previous suggestions here!
APY.Vision does not give investment advice and always insists that you do your own research. Read our full Legal Disclaimer.
Check out APY.Vision!
APY.Vision is an advanced analytics tool for liquidity pool providers and yield farmers. If you’re using any DEXs, AMMs, or liquidity pools this is the tool you will need to easily track the ROI of your liquidity provider and yield farming activities. Try it now!