The Ultimate Guide to Fees on Uniswap
In this post, you will learn how to track your Uniswap fees collected and ROI and view in-depth analytics to make better investment decisions when entering or exiting any Uniswap v3 pools.
What is Uniswap and what role do fees play?
Uniswap is a decentralized exchange that operates on several blockchains, starting on Ethereum and later deploying to chains such as Polygon, Arbitrum, and Optimism. Traders can easily swap ERC-20 tokens and will be charged a small fee to facilitate the swap. The fees are currently then distributed to users who are providing liquidity to the various liquidity pools on the platform. The way fees work in the system has changed in the recent upgrade from version two to version three.
How fees work in Uniswap V2
In Version 2 of Uniswap, any fees that are generated through trading activity are automatically deposited back into the liquidity pool, creating an auto-compounding effect for liquidity providers. The liquidity provider owns the same percentage “share” of the pool, but the amount of tokens in the pool goes up when a fee is charged to a trader for a swap.
What is new in Uniswap V3?
Uniswap v3 introduces innovative new features that work to increase capital efficiency and focus on active market makers rather than passive ones. Concentrated liquidity gives individual liquidity providers (LPs) granular control over what price ranges their capital is allocated to. Multiple fee tiers allow LPs to be appropriately compensated for taking on varying degrees of risk and to reduce trading fees for pools with high volumes. These new features have proven to be popular with traders and market makers. Studies have shown that Uniswap V3 has deeper liquidity on popular trading pairs than the large centralized exchanges like Coinbase and Binance.
What is the difference between fees on Uniswap V2 and Uniswap V3?
There have been some major changes to the way fees are distributed when comparing Uniswap V2 and V3. In Version 2, fees were automatically reinvested into the liquidity pool and that is no longer the case in Version 3. In Uniswap V3 the fees are collected separately from the pool and require manual redemption triggered whenever the owner of the position wants to collect their fees.
Uniswap V3 also introduces the concept of multiple fee tiers which will be explained in the next section. Uniswap V2 had only one fee tier, a flat 0.30% fee for all pools.
What are the fee tiers on Uniswap V3?
Liquidity providers can currently create or join pools at four fee levels:
- 0.01%
- 0.05%
- 0.30%
- 1.00%
More fee levels can be added by UNI governance should the community decide there is a need for additional fee tiers. Lower fee tiers attract trading volume but decrease revenue for liquidity providers.
What factors contribute to ROI and fees collected on Uniswap?
- Pool Parameters – which fee tier was set for pool
- Volume – higher volume pools generate more fees
- Tick Ranges – More fees will be collected in tight ranges
- Impermanent Loss – will be amplified in tight ranges, less impact with wide ranges
- TVL (Total Value Locked) – Fees generated by pool have to be be shared with other liquidity providers
- Volatility – large swings in price can amplify impermanent loss
How much fee revenue does Uniswap generate?
Sample of Fees collected by Uniswap in a 24 hour period
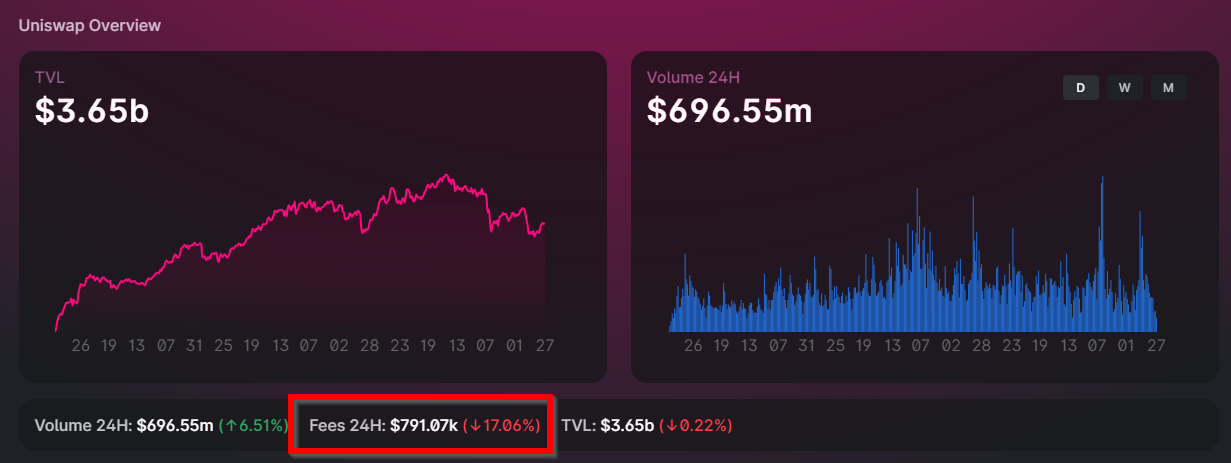
You can see in the above example that Uniswap generated around $800K USD in one 24 hour period recently (July 2022)
Revenue/Fees Generated by Uniswap in 2022
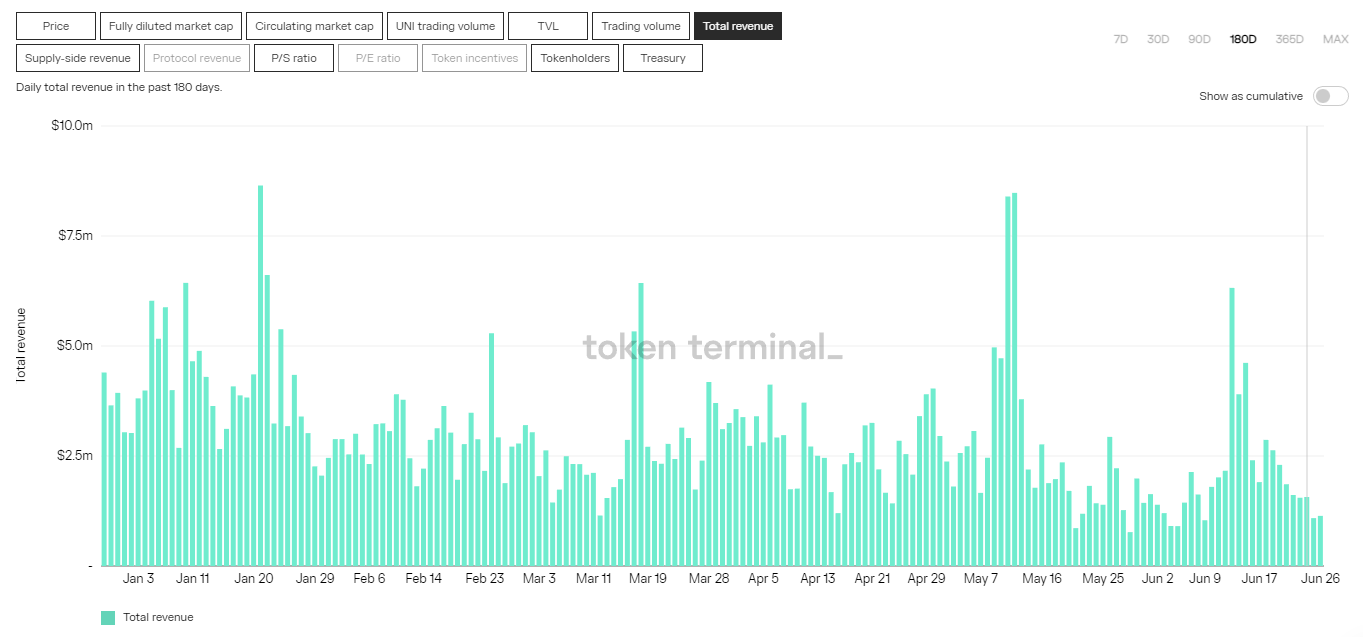
The graph above shows some historical earnings for the Uniswap platform, you can see several periods where daily fee revenue for liquidity providers was over $5 million USD.
Tracking your Uniswap ROI and fees collected with APY.vision
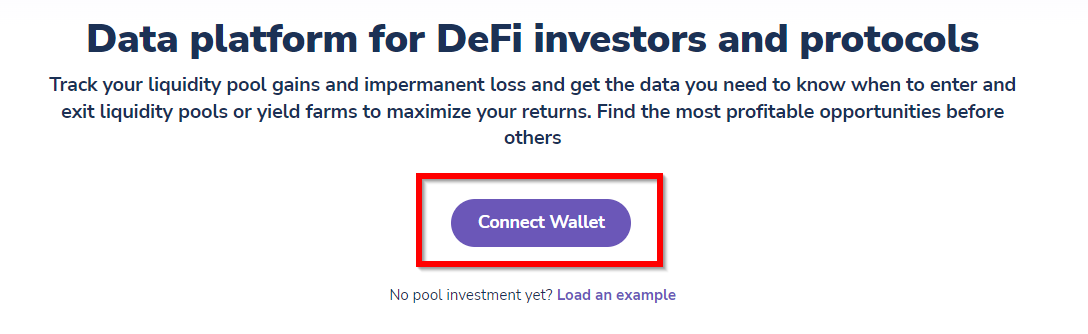
First time APY.vision users – Enter the APY.vision app and connect your wallet by clicking the box highlighted above. On mobile/tablets click on the search icon and copy their address into the popup. Uniswap V3 is a fantastic new innovation but is very complex and requires deep analytics to be aware of everything that is happening with your position. APY.vision has key features that can surface this information.
APY.vision free dashboard for Uniswap V3
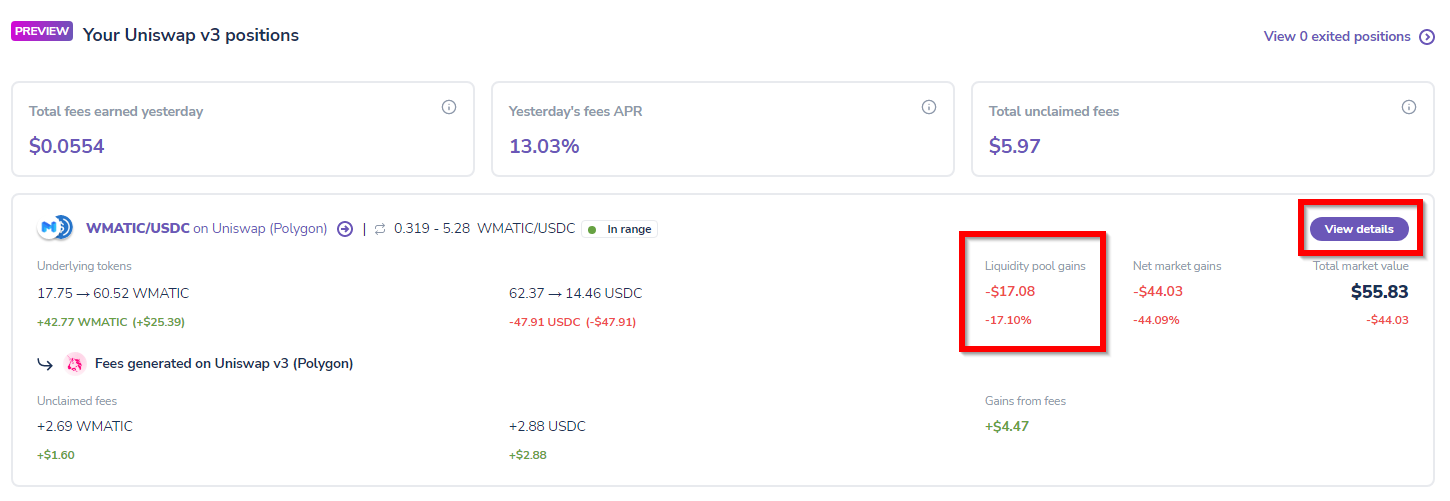
In the basic portfolio dashboard view as pictured above, you will see a basic readout of your token balances in your Uniswap V3 position. The highlighted area displays the “Liquidity Pool Gains” which is calculated using fee revenue and impermanent loss. This calculation does not include the changes in the token prices, that is reflected in the calculation labeled “Net Market Gains”.
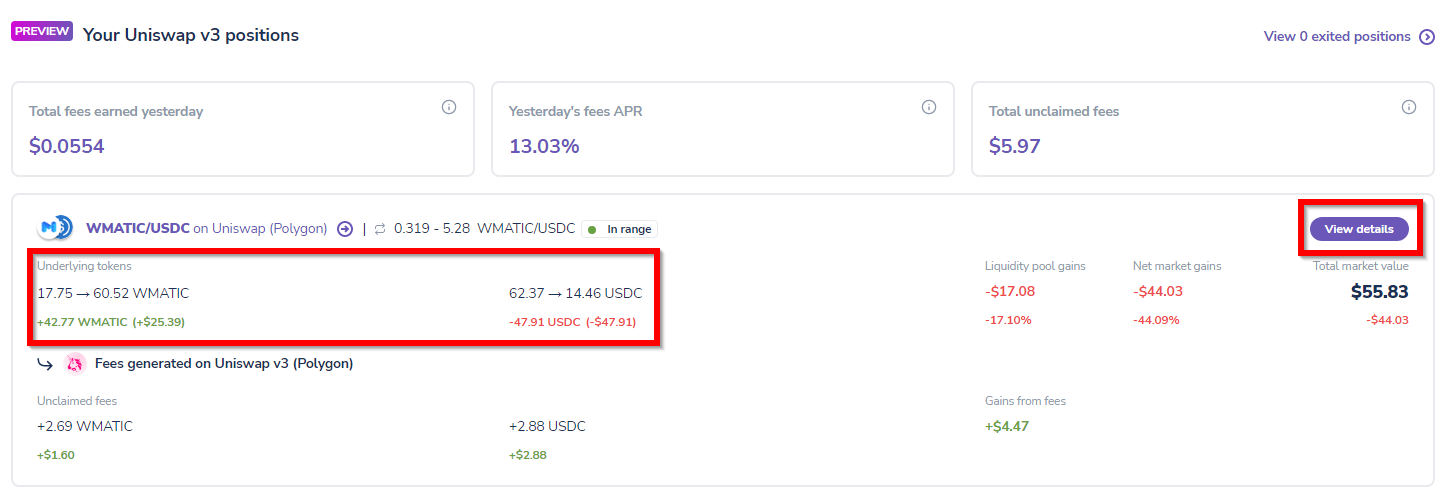
The section highlighted above shows the underlying token balances, which can also be used to get a sense of the impermanent loss. It displays the amount of tokens that were initially deposited and compares them to the amount of tokens the user would receive if they withdrew their share of the pool at the present time. It also highlights the quantity changes and USD value of the token balances so users can quickly see what amounts of each token they are gaining or losing.
To get more extensive detailed information, click the “View details” button.
Note:The “View details” feature is locked for our Pro members!
Uniswap V3 pool position fees
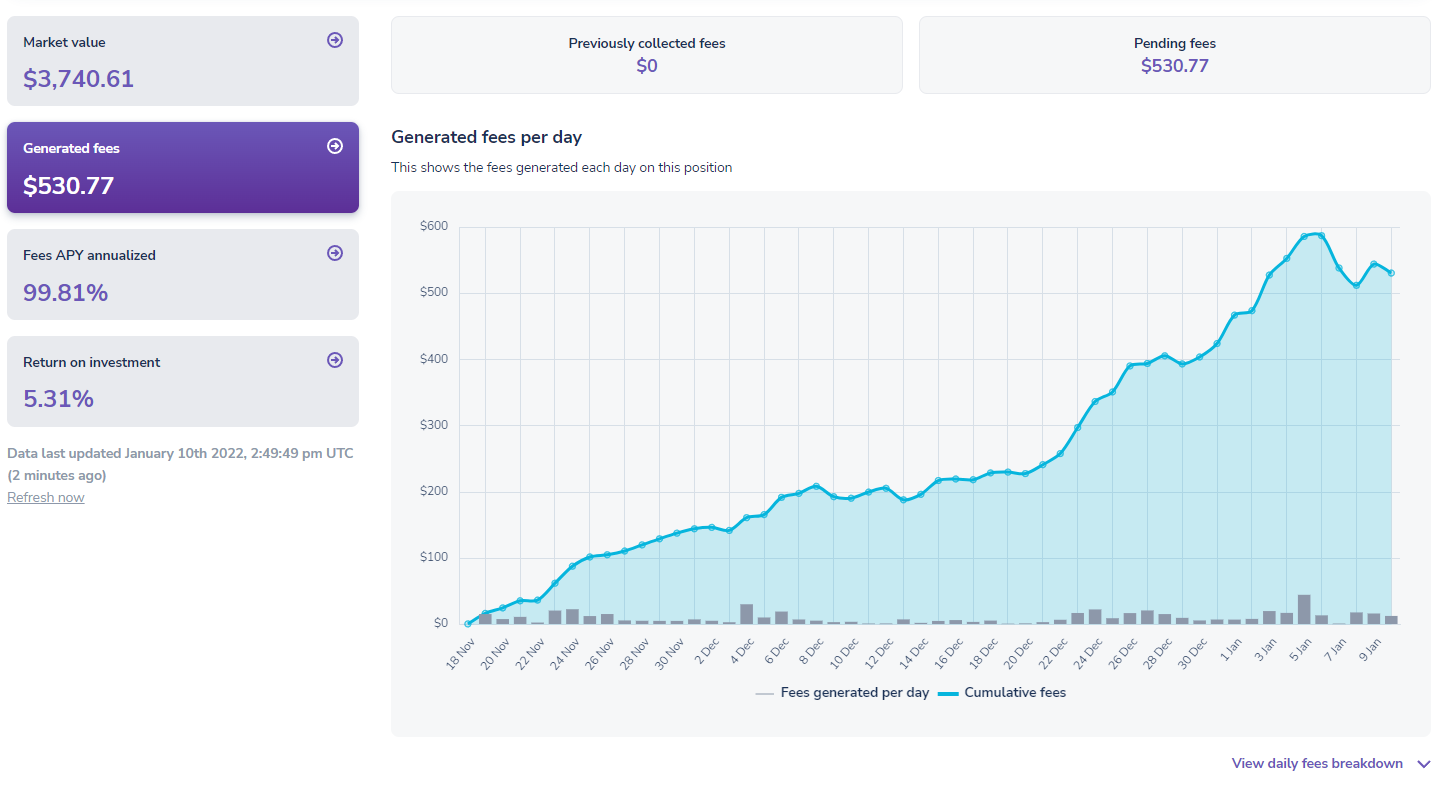
Clicking down to the next tab “Generated Fees” will show a chart with daily fee revenue, cumulative fee revenue, and the total amount of pending fees.
Uniswap V3 position fees APY (annualized display)
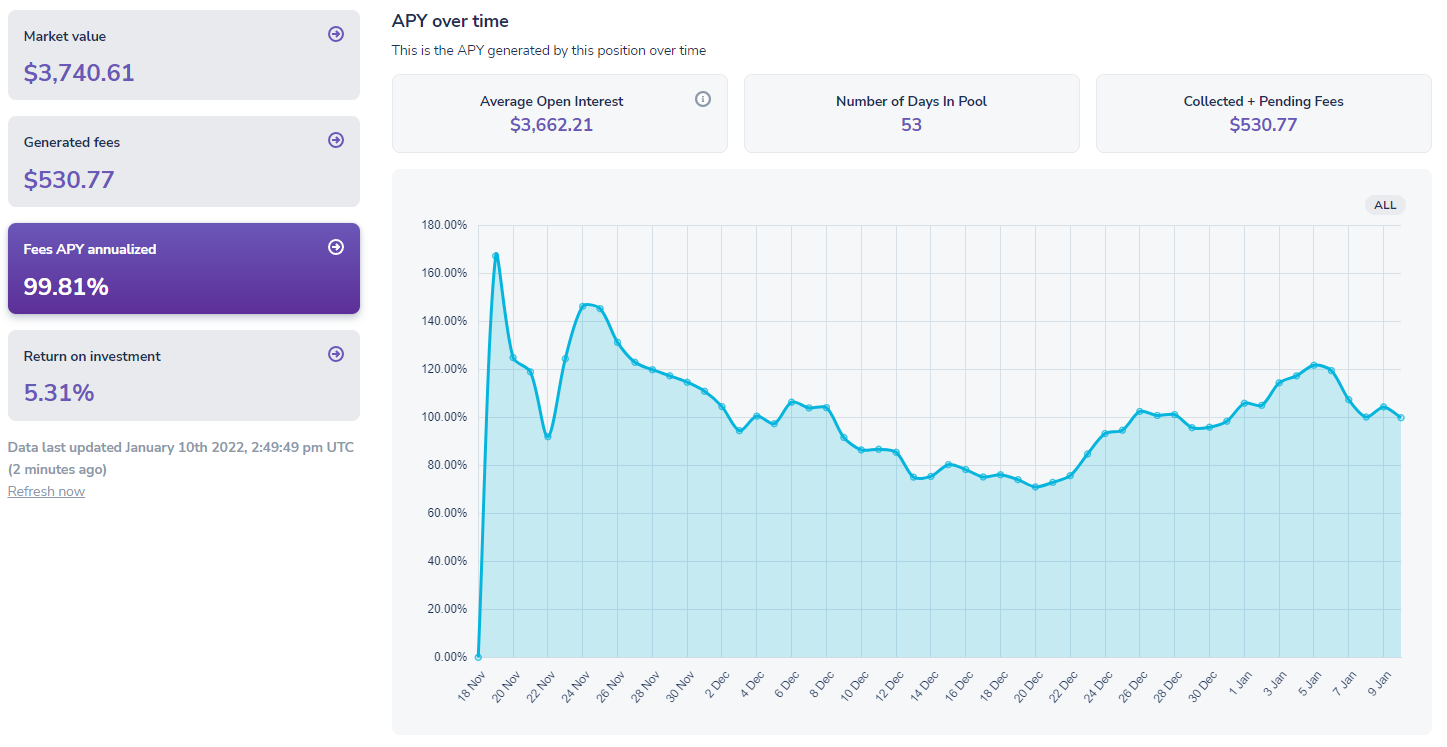
The next tab below titled “Fees APY annualized” displays a chart showing the performance of the position in APY terms to indicate hypothetical yearly performance since inception. Soon we will show prior day APY, prior 7-day APY, etc. Make sure to follow us on Twitter or Discord to get notified about future updates!
Uniswap V3 pool position ROI
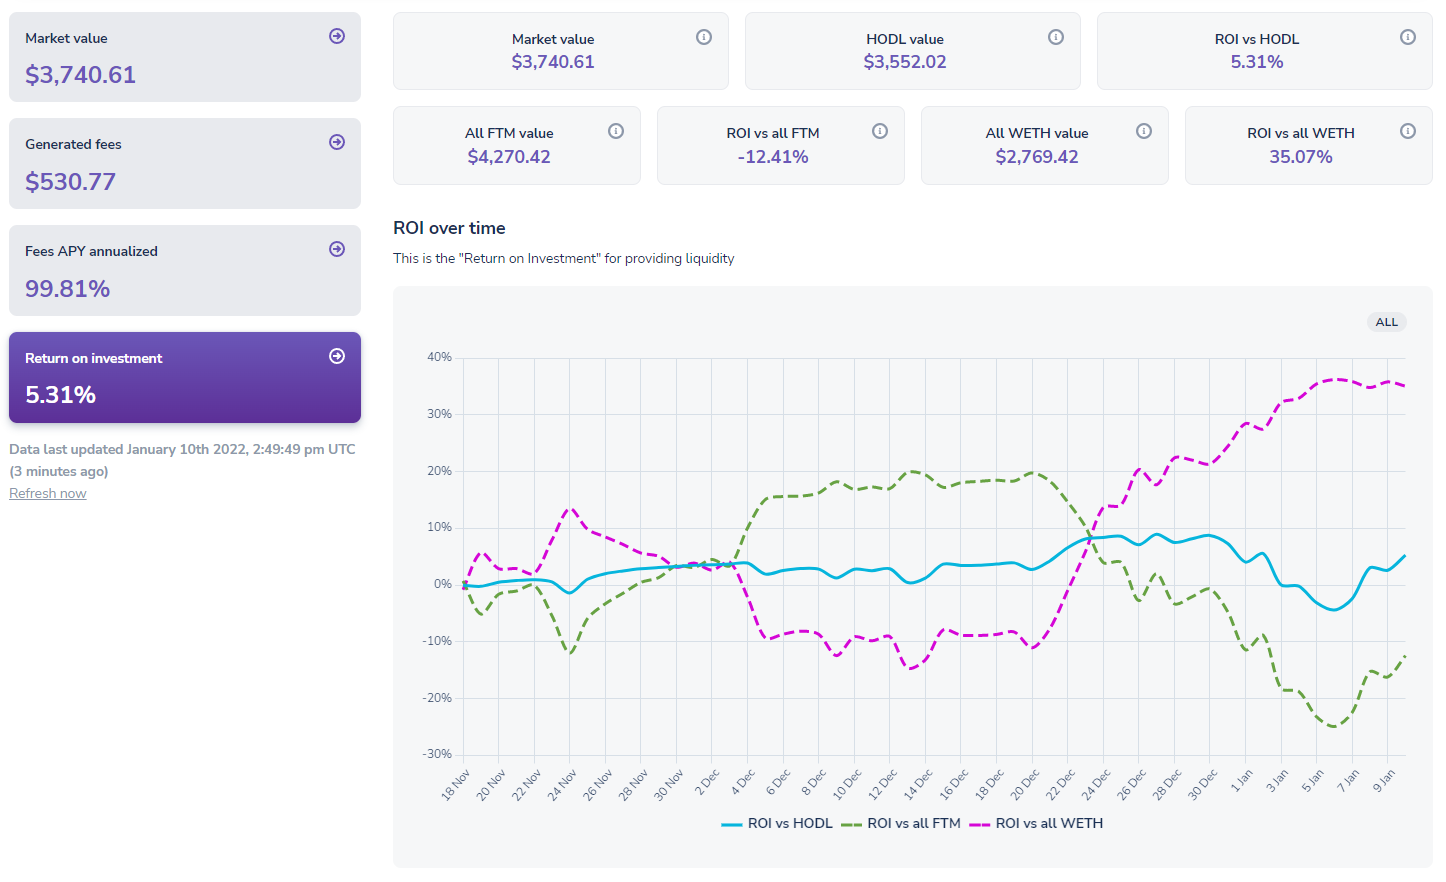
The final tab shows “return on investment” and gives several hypothetical situations to compare your performance with. It compares the market value with the value if you had held the same position and not provided liquidity to the pool and computes a figure labeled “ROI vs HODL” to show the relative increase or decrease in performance. Much like the first chart, it also compares the different situations like holding 100% of either of the tokens instead of entering the pool.
Become a Pro member for enhanced tracking on your Uniswap V3 positions
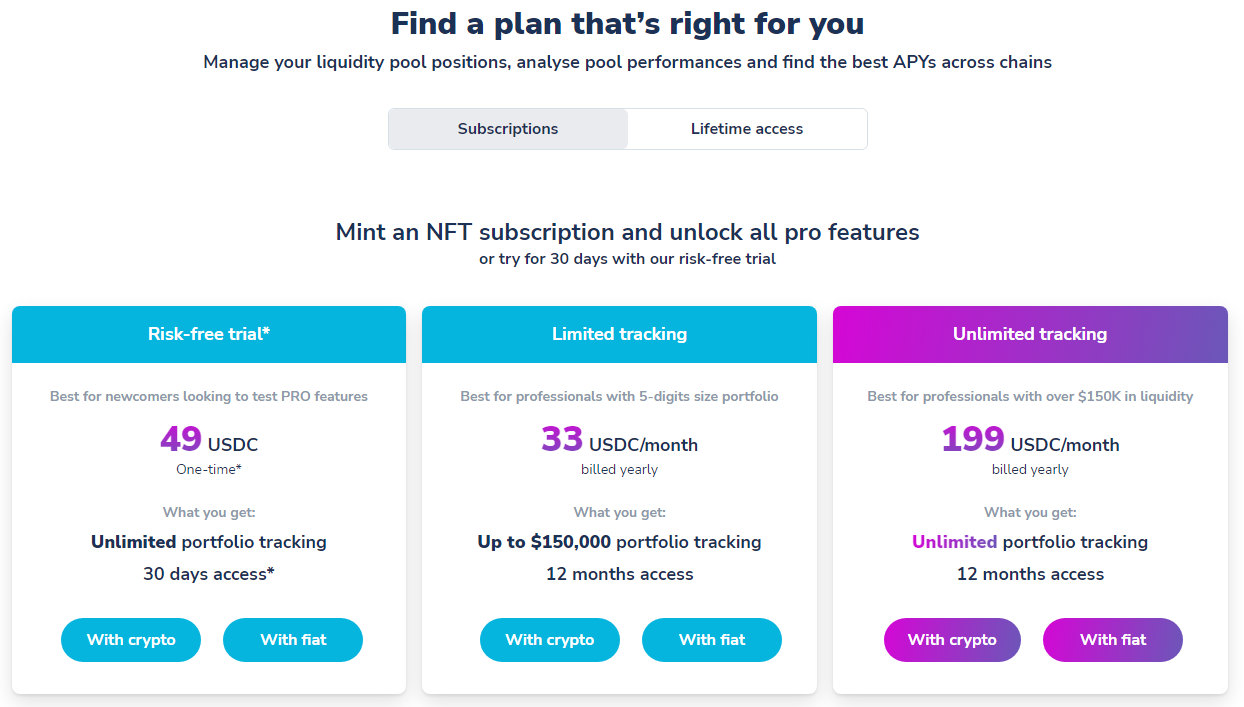
All users can track the basic details of their Uniswap V3 position with our free version. Check out our Pro plan offerings to find out how you can get real-time data and other enhanced statistics about your positions!
Conclusion
Providing liquidity is a great way to earn some income on tokens sitting in your wallet. You do have to be careful when providing liquidity, as sharp price increases or decreases can have a huge impact on the performance of your position. We suggest using APY.Vision to keep a close eye on your positions to know when to remove liquidity during times of extreme price volatility.
Join our Community!
If you have any questions about the new features on APY.vision, feel free to come join our Discord community and share them! Our community is super helpful and we always like to hear input from our users. If you experience and bugs or notice problems with the website, you can create a ticket via our support system. If there are features you would like to see added to the website, you can make suggestions or vote on previous suggestions here!
APY.Vision does not give investment advice and always insists that you do your own research. Read our full Legal Disclaimer.
APY.Vision is an advanced analytics tool for liquidity pool providers and yield farmers. If you’re using any DEXs, AMMs, or liquidity pools this is the tool you will need to easily track the ROI of your liquidity provider and yield farming activities. Try it now!